

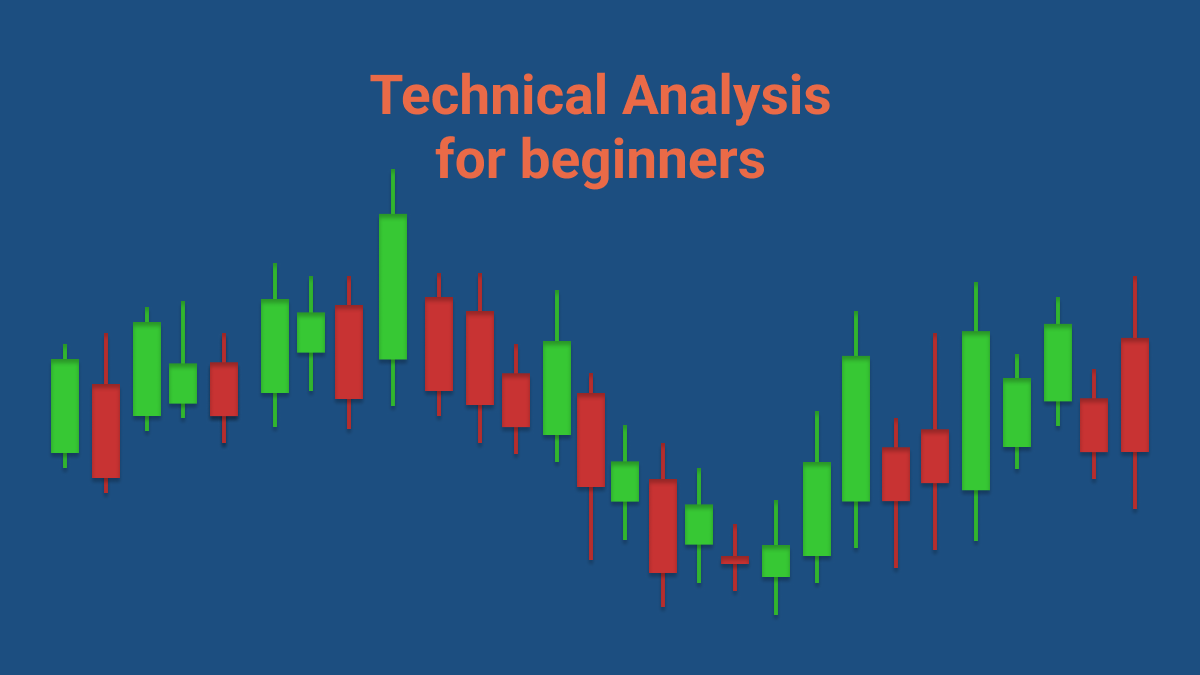
What Is Technical Analysis?
**Technical analysis (TA)** is the study of **price action and historical data** to predict future market
movements.
Its based on the idea that price reflects everything and history tends to repeat itself.
Unlike fundamental analysis, which looks at economic data or news, TA focuses on **charts,
indicators, and patterns.**
—
### Why Technical Analysis Matters for Funded Traders
If youre trading with a prop firm like **Top1Funded**, you need:
– A consistent strategy- Clean entries and exits
– Smart risk management
And **TA gives you all of that.**
Whether youre trading Forex, Futures, or Crypto knowing how to read a chart is essential.
—
### Core Concepts of Technical Analysis
#### 1. **Support and Resistance**
– **Support** is a price level where demand tends to prevent price from falling lower.
– **Resistance** is where sellers step in and prevent price from rising higher.
*Tip:* Look for multiple bounces at a level these are key zones.
—
#### 2. **Trendlines**
– Drawn across swing highs or lows to identify the direction of the market.
– Uptrend = higher highs and higher lows
– Downtrend = lower highs and lower lows
*Tip:* Breakouts of trendlines can signal potential reversals or momentum shifts.
—
#### 3. **Chart Patterns**
– Help visualize where price might go next.
Common ones include:
– **Triangles** (continuation or breakout)
– **Head & Shoulders** (reversal)
– **Flags/Pennants** (momentum continuation)
*Tip:* Patterns are more reliable on higher timeframes.—
#### 4. **Candlestick Formations**
Candlesticks give insight into price behavior over a set time period.
Some key ones:
– **Doji** indecision
– **Engulfing** strong reversal signal
– **Hammer / Shooting Star** potential bottom/top
*Tip:* Use them in context theyre stronger at support/resistance zones.
—
#### 5. **Indicators & Tools**
Indicators can help confirm price action not replace it.
Popular ones:
– **Moving Averages (MA)** trend direction and dynamic support/resistance
– **Relative Strength Index (RSI)** overbought/oversold conditions
– **MACD** momentum and potential reversals
– **Volume** strength behind a move
*Tip:* Stick to 13 indicators max to avoid analysis paralysis.
—
### How to Use TA in a Funded Account
When trading a Top1Funded account:
Use TA to plan clean, low-risk entries
Keep your strategy simple and repeatable
Combine chart levels + indicators + confirmation
Avoid impulse trades follow the planRisk management + technical structure = a funded trader who gets paid.
—
### How Top1Funded Supports Your TA Strategy
We give you:
– Multiple funding models (Instant, 1-step, 2-step)
– Access to charts and platforms that support your tools
– Fast payouts even during evaluation (Futures)
– No minimum days, no consistency rules, no forced SL
– Trade Forex, Crypto, and Futures your way
Whether you trade using trendlines or RSI divergences **your strategy is welcome here**.
—
### Final Thoughts
You dont need to memorize 100 indicators to become a great trader.
Master a few technical tools, apply them with discipline, and manage risk like a pro.
Ready to put your TA skills to work with real capital?
Check out our funding programs now at [Top1Funded.com](https://top1funded.com)